
Data-based DevOps orchestration

Problem
Effort and costs for DevOps are high. Time-to-market for new releases is still too long, optimization seems to only be possible with significant additional effort. There is no overview of the entire SDLC: it is difficult to understand which parts of the original planning makes it into a release in what form and why.
Solution
Data-based end-to-end orchestration of the SDLC creates an overview. The automation is functionally linked to data and creates a compellingly correct and up-to-date view of the entire SDLC. Optimization potential becomes visible and – thanks to flexible, Python-based automation – can be implemented with little effort. Collaboration between teams increases, time-to-market becomes shorter.
The problem
- Costs for DevOps are high: a huge amount of time is invested in maintaining CI/CD pipelines and DevOps tools.
- The added value of automation is not fully understood: time-to-market for new features is still high and release frequency is low. Automation is not end-to-end, so a lot has to be done manually.
- Information flow between teams is low, dependencies between teams lead to conflicts and errors.
- End-to-end view of the entire software development lifecycle (SDLC) from planning to deployment is missing. Example: Status of build and tests are visible in the CI/CD tool, but deployments are not. Or: Release planning takes place in the ticketing system. Since there is no connection from the ticket to the rest of the pipeline, it is not clearly traceable which tickets / features are contained in a release and in which form.
The solution
- Data-based analysis of DevOps process reveals bottlenecks, gaps and dependencies
- Data is read from existing systems. Automation remains in existing systems (where available) and is orchestrated by the overlying database. Added value of existing pipelines and tools can be used as before, while gaps can be filled through flexible, Python-based automation
- Providing information across the SDLC increases information flow between teams, facilitates collaboration and dependency management, and creates an overview of the overall process.
- Automations that are functionally linked to the data empower developers, DevOps experts, and other stakeholders by directly presenting tools that make their own work faster and easier
How it works
Flexible data model for SDLC: Get started quickly with a best-practice base model to map the software development lifecycle. The data model is flexible and fully customizable to your needs. By gradually extending and adapting the data model, insights into your SDLC become more and more detailed over time.
Where does the data live?
- Data is stored in a Master Data Management (MDM) system or a relational database (e.g. PostgreSQL).
- If you already use an MDM or comparable system, this can be connected.
- Alternatively, we provide an MDM or DB for data storage as part of the Cloudomation Engine platform.
What does the data model look like?
- To enable a quick start, we offer a generic, lightweight best-practice model that is compatible with all common software development methods.
- The data model describes which entities are important for your software development and how they relate to each other. It forms an ontology for your SDLC. Example: the entity “commit” is mapped in the data model with an ID and the properties push_id, commit_sha, author_name, author_email, message and timestamp. Other fields as well as other entities can be easily added – e.g. to store additional information about the author of a commit.
- The goal of the data model is to enable a quick start and step-by-step optimization. The focus is on the right level of best-practice framework we recommend and maximum flexibility to adapt the data model to your exact needs and data situation.
Connection of existing tools: Mapping the SDLC is not “dry documentation work” but takes place by connecting existing tools to the data model (live). Data is continuously read or received from existing systems (e.g. via webhooks). Links to detailed information in source systems create a central overview with the possibility to retrieve further information on any point at any time.
Which tools can be connected?
- You can connect any tools such as Ansible, Jenkins, Terraform, all common cloud services, ticketing systems etc.. As long as a tool allows some form of external access, it can be accessed and orchestrated via Cloudomation Engine.
- You can also trigger scripts in any programming language via Cloudomation Engine and monitor their execution. For example, if you use existing scripts in bash or powershell (or any other language) in your DevOps processes, you can continue to use them and centrally manage, log and orchestrate them via Cloudomation Engine.
- It is also possible the other way around for other tools to call Cloudomation Engine. For example, a pipeline that is already defined in Jenkins can be passed from Jenkins to Cloudomation Engine at a certain point, or Cloudomation Engine can be fed “only” with data about the pipeline, while the automations remain in Jenkins.
- The goal is to give you maximum flexibility to allow gradual entry and continuous optimization. Continue to use what already works and invest your time only where there are problems.
How are tools connected?
- A variety of connectors allow connection of tools via standard interfaces and protocols, such as REST APIs, ssh, or DB connections. This allows Cloudomation Engine to actively access third-party systems and read out data.
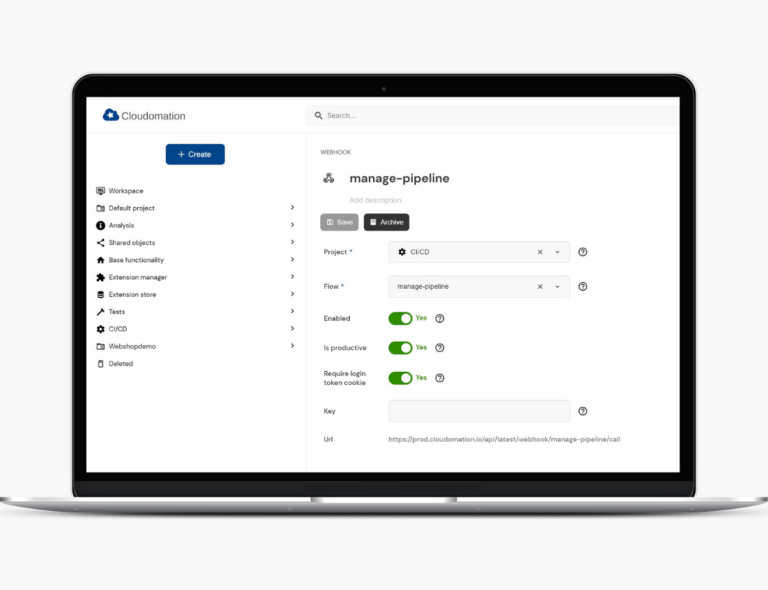
- The Cloudomation Engine API manager allows to accept data and notifications from third party systems. Webhooks are created in Cloudomation Engine with one click and can be entered into third party systems and notify Cloudomation Engine of a git commit, for example. Defining full custom REST APIs allows more complex integrations where Cloudomation Engine receives data in any format from third party systems.
- With Workspace Linking, multiple Cloudomation Engine “satellites” in different network segments can be interconnected to enable easy and secure connection of tools – e.g. connecting SaaS and on-premise solutions.
Data as a trigger for automations: by linking automations in the data model, the data becomes “functionally alive”. For example, entering a new version for a deployment triggers the deployment of the new version. The status of tests can not only be read out, but the tests can also be executed again. In doing so, existing automations remain in already existing systems.
Gradual expansion and closing of gaps: The ability to add lightweight, Python-based automations that close gaps in pipelines or add new capabilities makes it possible to optimize DevOps processes incrementally and continuously. The flexible orchestration options also allow existing automations in other tools to be extended and, for example, complex dependency networks to be taken into account by only calling automations in third-party systems once all the dependencies stored in the data model have been fulfilled.
The results
Decreasing effort for DevOps:
- Automated data collection drastically reduces time spent on troubleshooting.
- End-to-end overview significantly facilitates maintenance.
Optimization becomes possible, time-to-market decreases:
- As gaps and bottlenecks become visible, it becomes clear where improvement must begin.
- Optimization can take place step by step with the resources currently available.
Collaboration between teams improves:
- Information is available to all and dependencies become visible.
- Teams can act more independently, as they can operate the pipeline tools themselves.